
RESEARCH AND MUSINGS FROM A SHELTERED-IN-PLACE LONG-TERM INVESTOR …
Never has our country, let alone the world, experienced such abrupt, robust and simultaneous supply and demand destruction due to a pandemic.
So how much pain will the U.S. suffer as a result of the COVID-19 virus and draconian social distancing policies that have essentially shut down our economy?
And how far will the stock market decline before it climbs back to where it was only a few short months ago?
Let’s examine historically similar economic shocks to find or, at least, bracket the possible outcomes.
On Friday, according to the WSJ, three bank analysts updated their U.S. GDP forecasts:
- Goldman Sachs: -24% in 2nd quarter, +12% in 3rd quarter, +10% in 4th quarter
- JP Morgan: -14% in 2nd quarter
- Bank of America: -12% in 2nd quarter
The Bad News: No matter which analyst is right, a decrease of that magnitude would far outpace the largest quarterly drop in GDP on record—during the first quarter of the 1958 recession, when the U.S. economy contracted 10%.
Besides 1958, these were the three worst recessions in U.S. history, measured by largest GDP decline peak-to-trough:
# 1: 1929-1933 Great Depression (-26.7%)
# 2: 1937-1938 Recession (-18.2%)
# 3: 1945 Recession (-12.7%)
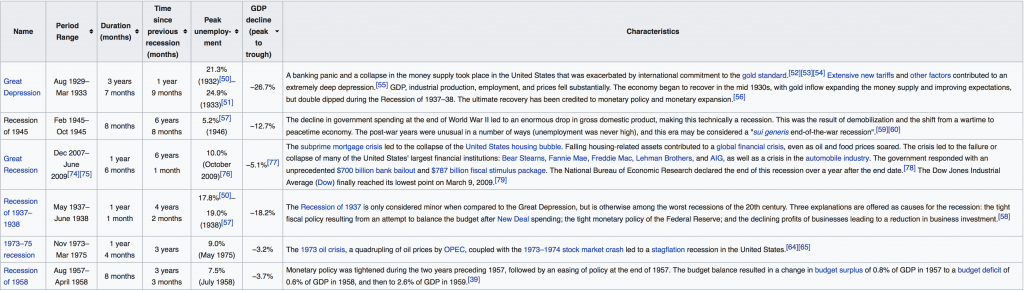
The Good News: All three analysts are predicting negative growth for only three months or one quarter, which means this economic event won’t even meet the technical definition of a recession: two successive quarters of negative growth. For reference, if we exclude the Great Depression outlier, the three other record breaking recessions lasted an average of 9.7 months or approximately three quarters.
Until COVID-19 is under control, no one really knows which 2nd quarter GDP forecast is accurate — Goldman Sachs’ -24% or BoA’s -12% — nor what impact those record setting declines would have on the stock market. Nevertheless, let’s review history to see how much the Dow Jones Industrial Average (DJIA) declined during our country’s worst recessions and how long it took to recover.
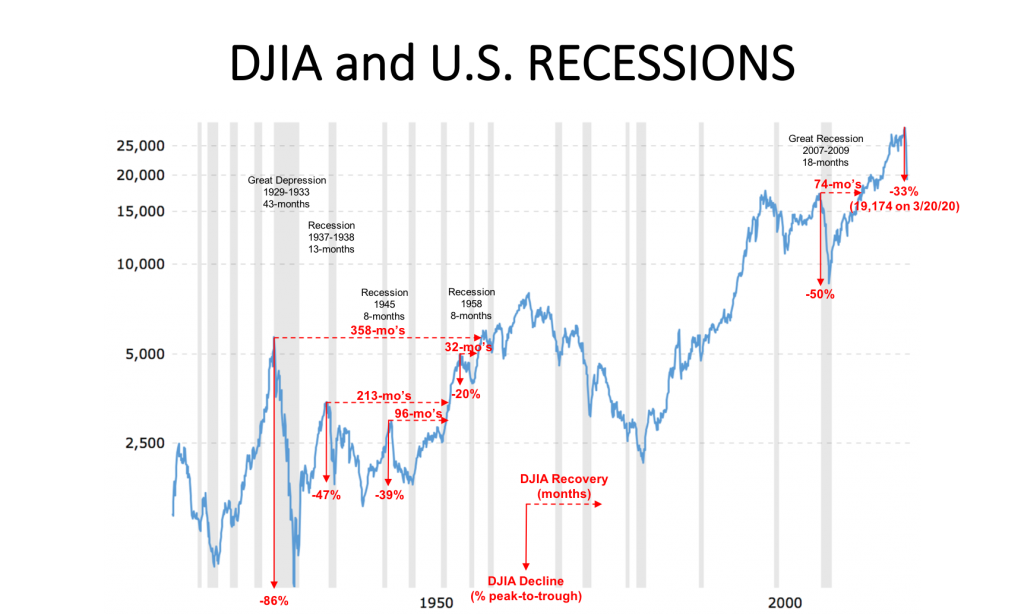
Again, excluding the Great Depression, the DJIA’s average recessionary decline was 39% and its average recovery duration was 104-months or 8.7 years. So, compared to the average of our worst recessions, the DJIA could still decline another 6% and take as long as eight years to reclaim its peak of 28,738 in December 2019.
However, considering the forecasted short (3-months) but unprecedented (-12% to -24%) GDP decline, the extraordinary strength of the economy and workforce heading into the COVID-19 pandemic, and the government’s novel multi-trillion-dollar plans for fiscal stimulus and monetary easing, we are headed into uncharted waters, making the outcome both unique and uncertain.
Here’s to hoping for a GDP decline and duration more in line with the BoA (-12%) and JPM (-14%) forecasts and a recovery period somewhere between the 1945 (96-mo’s) and 1958 (32-mo’s) recessionary experiences.
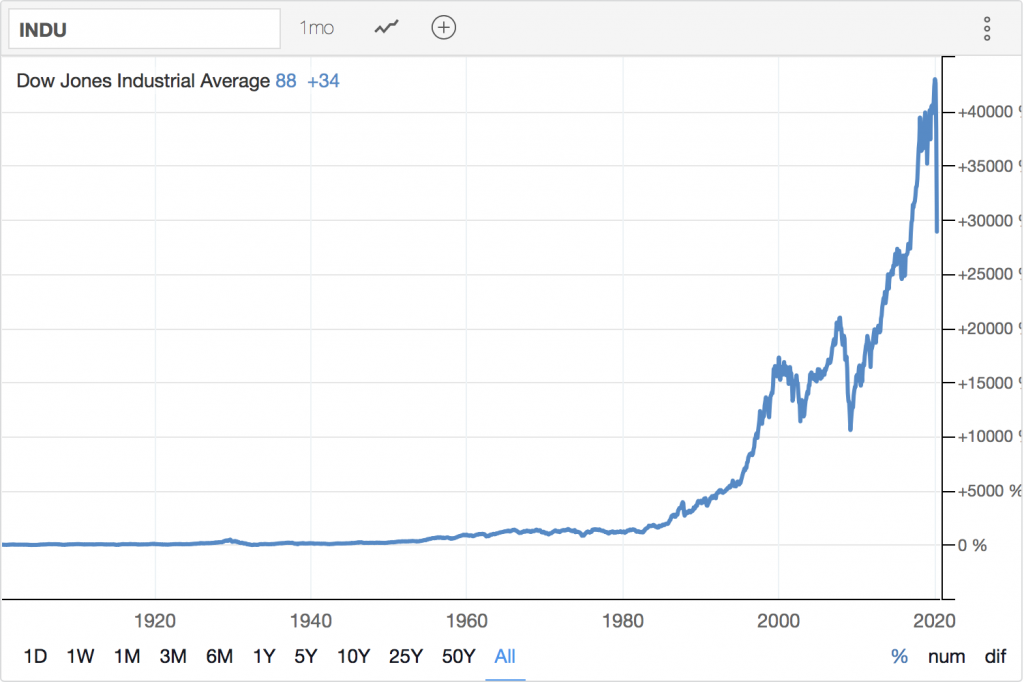
Just remember, though, massive wealth destruction is only a problem for short-term investors. Long-term, despite numerous pandemics and 23 recessions since 1900, the DJIA is up approximately 30,000%!
Hang in there everyone!